
Greetings!
We are pleased to share this week’s Tech Update, highlighting our latest achievement in analytics and dashboard development.
Peak Load Use Case – Dashboard Insights
Achievement Highlight
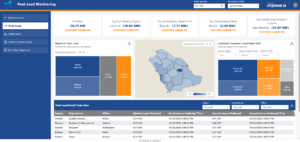
We successfully developed the Peak Load use case and published the results on the dashboard.
The dashboard delivers insights across multiple dimensions:
- KSA Level
- Department & Office
- Customer Segment
- Regional Levels
- Daily, Monthly, and Yearly Analysis
Key Analytics Visualized
- Load Curve – Shows consumption trends over time
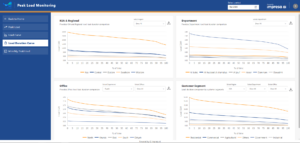
- Load Duration Curve – Highlights load distribution and demand patterns
These analytics enhance visibility and support better decision-making for load management and planning.
March Insights Snapshot
- Peak Load Date: 16th March
- Peak Time: Around 5 PM
- Top Contributors:
- Central Region
- Riyadh North Department
Consumption Pattern Analysis
The load curve indicates that during March:
- Peak Consumption Window: 2 PM – 9 PM
- High consumption was observed across different regions during this time
Business Impact
✔ Improved visibility into load behavior
✔ Data-driven planning and forecasting
✔ Enhanced operational decision-making
Next Steps
- Expand use case coverage
- Add deeper regional analytics
- Enhance dashboard interactivity
Please feel free to share your feedback or reach out for further details.
Thank you for your continued support.